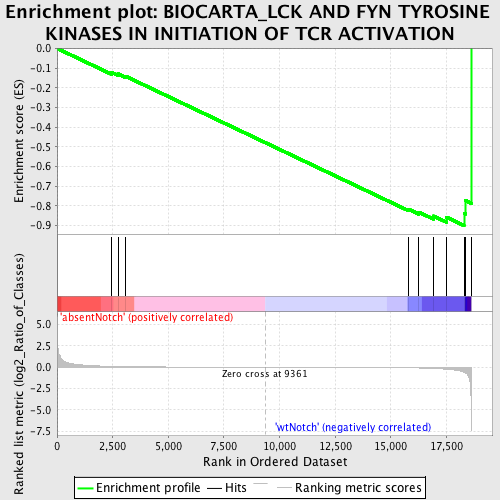
Profile of the Running ES Score & Positions of GeneSet Members on the Rank Ordered List
| Dataset | Set_03_absentNotch_versus_wtNotch.phenotype_absentNotch_versus_wtNotch.cls #absentNotch_versus_wtNotch.phenotype_absentNotch_versus_wtNotch.cls #absentNotch_versus_wtNotch_repos |
| Phenotype | phenotype_absentNotch_versus_wtNotch.cls#absentNotch_versus_wtNotch_repos |
| Upregulated in class | wtNotch |
| GeneSet | BIOCARTA_LCK AND FYN TYROSINE KINASES IN INITIATION OF TCR ACTIVATION |
| Enrichment Score (ES) | -0.9005528 |
| Normalized Enrichment Score (NES) | -1.4954451 |
| Nominal p-value | 0.026143791 |
| FDR q-value | 0.42806962 |
| FWER p-Value | 1.0 |
| PROBE | DESCRIPTION (from dataset) | GENE SYMBOL | GENE_TITLE | RANK IN GENE LIST | RANK METRIC SCORE | RUNNING ES | CORE ENRICHMENT | |
|---|---|---|---|---|---|---|---|---|
| 1 | PTPRC | 130402 5290148 | 2453 | 0.091 | -0.1221 | No | ||
| 2 | CD247 | 3800725 5720136 | 2736 | 0.074 | -0.1294 | No | ||
| 3 | FYN | 2100468 4760520 4850687 | 3063 | 0.058 | -0.1407 | No | ||
| 4 | LCK | 3360142 | 15797 | -0.069 | -0.8177 | No | ||
| 5 | CD4 | 1090010 | 16262 | -0.094 | -0.8326 | No | ||
| 6 | CD3E | 3800056 | 16914 | -0.148 | -0.8518 | No | ||
| 7 | ZAP70 | 1410494 2260504 | 17495 | -0.237 | -0.8577 | Yes | ||
| 8 | CD3G | 2680288 | 18293 | -0.577 | -0.8390 | Yes | ||
| 9 | CD3D | 2810739 | 18351 | -0.648 | -0.7728 | Yes | ||
| 10 | TRB@ | 3940292 | 18616 | -7.377 | -0.0000 | Yes |

